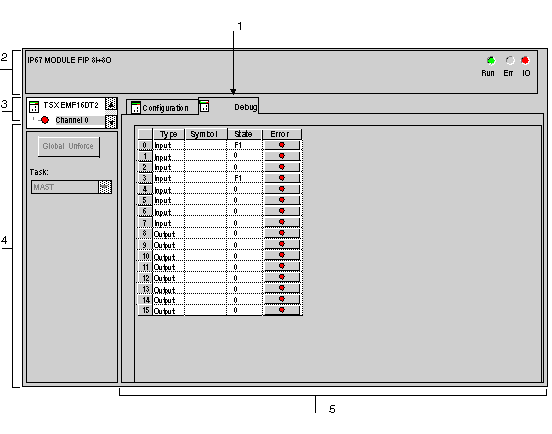
The debug screen displays the value and state of each of the selected module's channels in real time. It is also used to access the channel commands (forcing of the input/output value, SET and RESET).
The figure below represents a debug screen.
The following table shows the different elements of the debug screen and their functions.
|
Number
|
Element
|
Function
|
|
1
|
Tabs
|
The tab in the foreground indicates the mode in progress (Debug in this example). Every mode can be selected using the respective tab.
|
|
2
|
Module area
|
Specifies the abbreviated heading of the module.
In the same area there are 3 LEDs which indicate the module’s operating mode:
-
RUN indicates the operating status of the module,
-
ERR indicates an internal fault in the module,
-
I/O indicates a fault from outside the module or an application fault.
|
|
3
|
Channel area
|
Is used:
-
By clicking on the reference number, to display the tabs:
-
Description which gives the characteristics of the device.
-
I/O Objects which is used to presymbolize the input/output objects.
-
Fault, which shows the device faults (in online mode only).
-
Channel: module channel number. To the left of the symbol there is a copy of the CHx channel LED.
|
|
4
|
General parameters area
|
Gives a reminder of the channel setting:
|
|
5
|
Parameters in progress zone
|
This zone displays the state of the inputs and outputs, and the different parameters in progress.
For each of the channels, there are four columns:
-
The Type column for indicating the type (input or output),
-
The Symbol column displays the symbol associated with the channel when it has been defined by the user (using the variable editor),
-
The State column displays the state of each of the module’s channels and enables their forcing,
-
The Fault column creates direct access to the diagnostics for each channel when these are faulty (indicated by the indicator lamp built into the diagnostics access button, which turns red).
|